A production-safe method for diagnosing a slow WordPress site without randomly deleting plugins, changing hosts, or installing another optimization layer. 
Editorial promise#
This guide rejects plugin-count folklore and one-number speed scoring. Recommendations are tied to measured bottlenecks on real business pages and must preserve functional correctness.
The Sazvara framework#
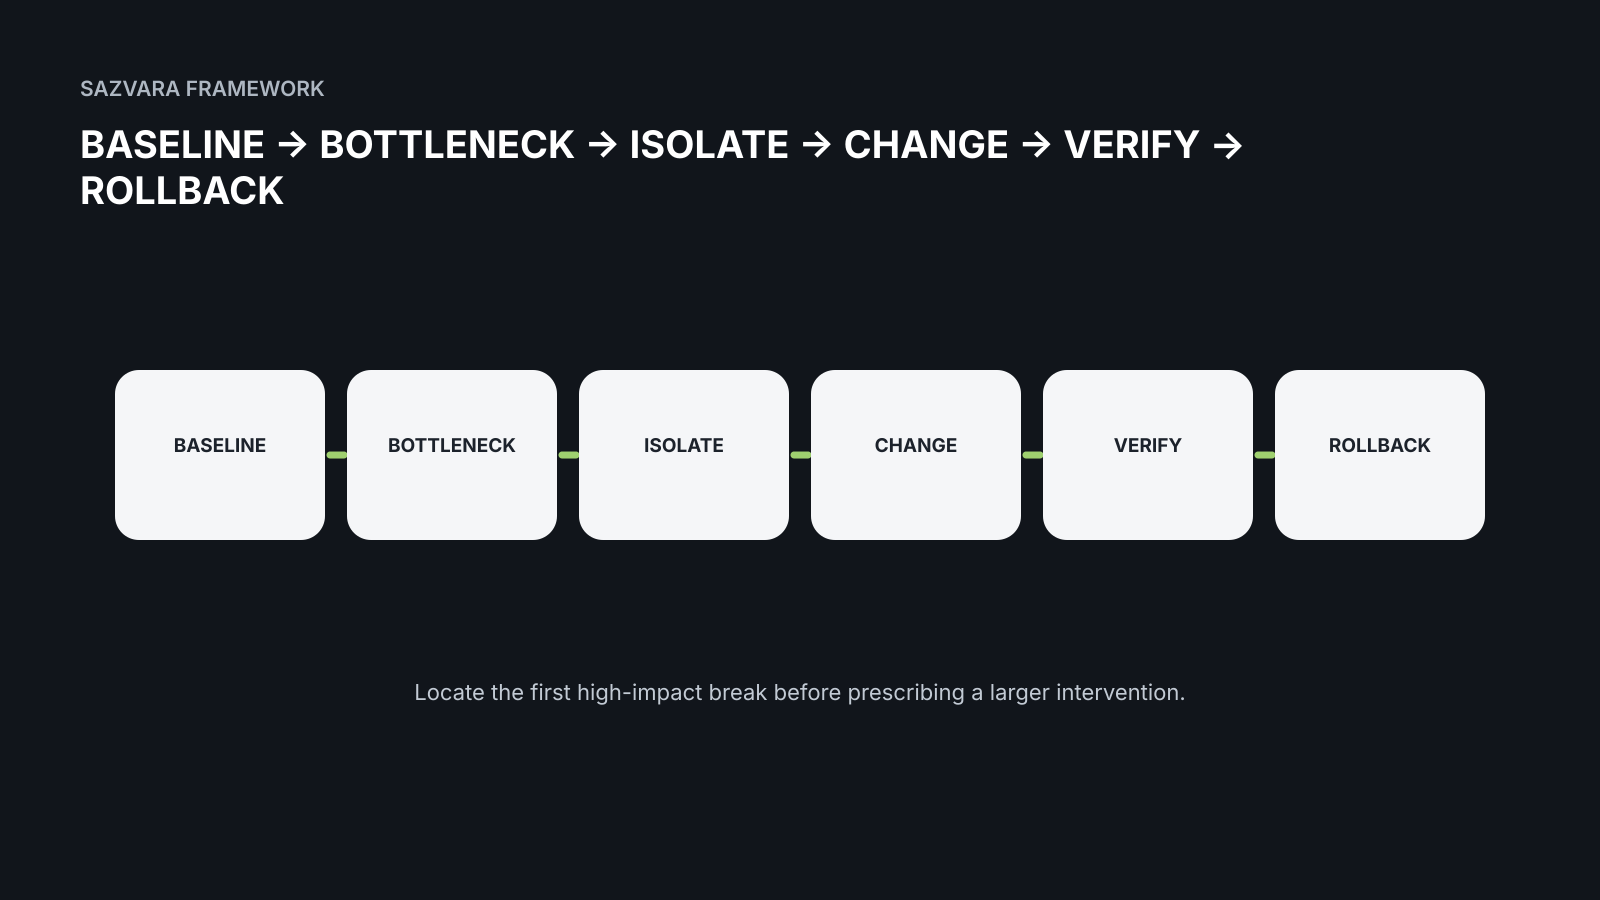
BASELINE → BOTTLENECK → ISOLATE → CHANGE → VERIFY → ROLLBACK
The short answer#
A slow WordPress site should be diagnosed before it is “optimized.” Measure representative pages, identify whether the bottleneck is front-end delivery, server execution, database work, external services or content weight, and change one meaningful constraint at a time.
Random plugin removal or stacking caching tools can change symptoms without producing a stable understanding of the system.
Evidence anchors#
- Core Web Vitals — User-centered performance measures provide a common baseline for important pages.
- WordPress performance optimization — WordPress performance work spans caching, database, assets and server behavior.
- WordPress caching — Caching layers solve different problems and need clear ownership.
- WordPress Site Health — Site Health surfaces configuration and environment information useful in diagnosis.
- WordPress backups — Backups are a prerequisite for risky production changes.
- WordPress hardening — Performance changes should not weaken security controls.
- Lighthouse overview — Lab tooling provides repeatable diagnostic signals but should not be mistaken for complete field behavior.
- Chrome performance docs — Browser profiling helps isolate main-thread, rendering and script costs.
- web.dev image performance — Image format, dimensions and loading behavior can dominate page weight.
- web.dev font performance — Font loading can affect render timing and layout behavior.
Establish a rollback position#
Before performance work, confirm backups, access, current versions and a recovery path. Optimization often touches caches, themes, plugins, databases, CDNs and server configuration.
A measured site is not useful if the diagnostic process creates a production incident.
Choose representative pages#
Test the homepage, a content-heavy page, the primary service or conversion page, and any template known to be slow. Include logged-in or ecommerce flows if they matter to the business.
Do not optimize only the fastest or most visually simple page.
Separate field and lab data#
Field data reflects real users and devices; lab tests provide repeatable diagnostics. Use both when available. Core Web Vitals are useful user-centered measures, but the root cause may sit in server time, JavaScript, images, fonts or third-party scripts.
Avoid chasing a single score without understanding the page.
Check the front-end payload#
Large images, unnecessary video, render-blocking resources and excessive JavaScript can create obvious delay. Resize and compress media appropriately, lazy-load what is not immediately needed and remove assets that provide little value.
Performance work should preserve the conversion hierarchy rather than simply stripping the page.
Inspect plugins by function and cost#
Count is a weak proxy for performance. One plugin can create heavy database queries or external calls while ten small plugins remain inexpensive. Profile behavior where possible and understand what each plugin contributes.
Do not disable revenue-critical functionality in production merely to see whether a score improves.
Review server and PHP behavior#
Check server response time, resource limits, PHP version compatibility, caching layers and error logs. Slow requests can come from application code, database queries or external dependencies.
Hosting changes are justified when evidence shows the current environment is a constraint, not because a faster plan is marketed aggressively.
Inspect the database#
Autoloaded options, expired transients, large tables and inefficient queries can create persistent delay. Database work should be backed up and tested because cleanup scripts can be destructive.
Use WordPress and database tooling deliberately rather than copying generic optimization commands.
External calls and third-party scripts#
Analytics, chat, scheduling, ads, maps, consent tools and embedded widgets can dominate the user experience. Inventory them and identify which are commercially necessary.
Load expensive third-party features only where they are needed when possible.
Caching with clear ownership#
Page cache, object cache, CDN cache and browser cache solve different problems. Overlapping layers can make debugging difficult when nobody knows which component owns invalidation.
Document the cache path and test content updates, logged-in behavior and dynamic pages.
Protect forms and ecommerce flows#
Aggressive optimization can break dynamic behavior. Test forms, carts, checkout, authentication and any personalized content after changes.
A faster page that loses enquiries is not an improvement.
Verify with the same baseline#
Retest the same pages, devices and scenarios. Compare not only performance metrics but functional behavior and conversion instrumentation.
Keep a short change log so improvements can be attributed to specific interventions.
Know when performance rescue becomes rebuild work#
If the theme or plugin architecture prevents safe removal of expensive behavior, a staged rebuild may become economical. That decision should follow diagnosis, not precede it.
The performance audit provides the evidence for whether the current system can be stabilized.
Where Sazvara fits#
Sazvara is strongest when WordPress performance problems are entangled with inherited code, fragile integrations or conversion-critical behavior. The first deliverable can be a bounded rescue assessment with measurements, bottlenecks, risk and a prioritized change plan.
That avoids spending a redesign budget on a problem that may have a smaller technical cause.
What good looks like in practice#
A strong performance rescue ends with an explanation, not just a higher score. The team can say which pages were representative, where the dominant delay occurred, what change addressed it and whether the same conversion-critical behavior still works. The before-and-after measurement uses the same conditions closely enough to support a causal conclusion.
Good WordPress performance work also reduces future uncertainty. Cache layers have named ownership, expensive third-party scripts are justified, plugin behavior is understood by function rather than count, and backups are real enough to support risky changes. If the diagnosis shows that the theme or architecture prevents safe improvement, the evidence can support a staged rebuild instead of turning performance work into endless tuning.
Decision table#
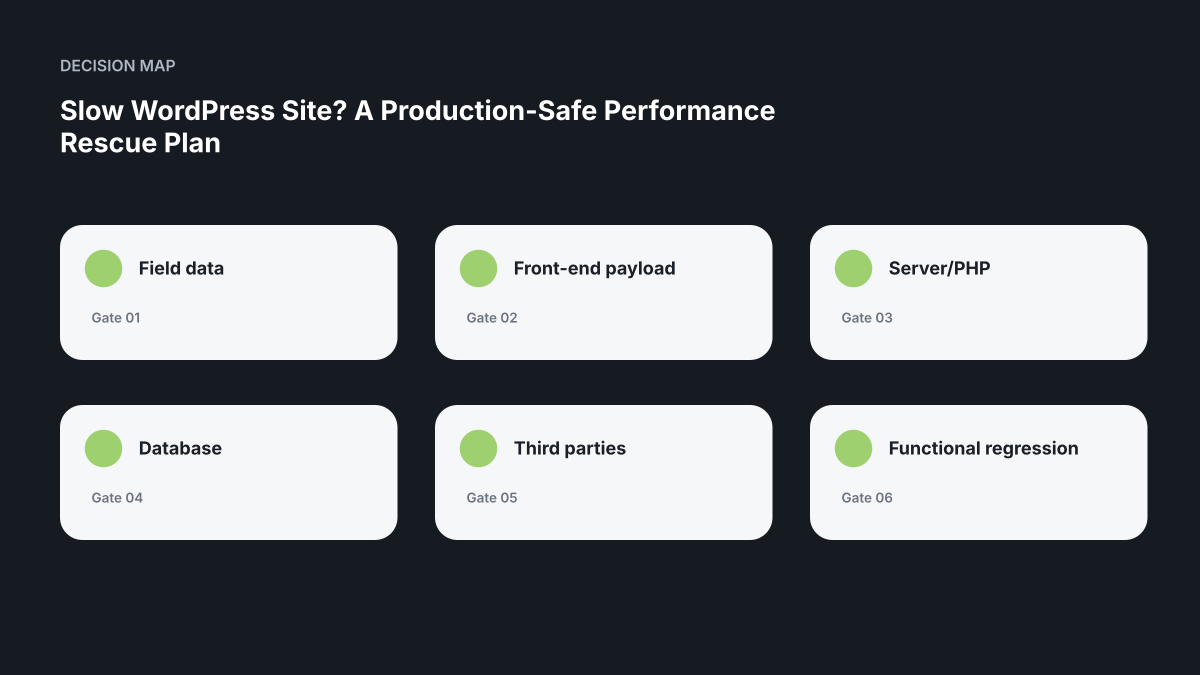
| Signal | What it usually means | First action |
|---|---|---|
| Large transfer / media dominates | Front-end payload | Optimize media and remove unnecessary third-party assets. |
| Server response dominates | Backend/hosting | Profile PHP, database and external calls before changing host. |
| Database work dominates | Data/query issue | Inspect queries, autoloaded data and table health with backups. |
| Only conversion pages are slow | Template-specific issue | Scope assets and plugins to where they are required. |
| Cache fixes speed but break forms | Correctness regression | Protect dynamic paths and retest business behavior. |
| Theme prevents safe isolation | Structural constraint | Consider staged rebuild after diagnosis proves the limit. |
Worked scenario#
An inherited WordPress site scores poorly in lab tests, and the owner assumes hosting is the problem. A controlled baseline shows server response is acceptable but the primary service page loads an oversized hero video, two chat widgets, multiple font files and JavaScript from plugins that are inactive on that page. Changing hosts would not address the dominant delay.
The first rescue removes unnecessary third-party scripts from the conversion path, replaces the hero asset, scopes plugin assets more carefully and verifies form behavior after cache changes. Hosting is reconsidered only after application-level bottlenecks are measured.
Implementation sequence#
Back up and document the current state. Baseline representative pages. Separate front-end transfer cost, main-thread work, server response and database behavior. Change the largest proven constraint first. Retest the same scenario and record the delta.
Avoid simultaneous cache, CDN, theme and plugin changes because they make causality impossible to establish.
Measurement plan#
Track field Core Web Vitals where available, lab diagnostics, server response time, transfer size, JavaScript execution, error rate and the successful completion of conversion-critical interactions. Pair performance metrics with lead-form or checkout health.
A faster site that breaks dynamic behavior has regressed.
Operating scorecard#
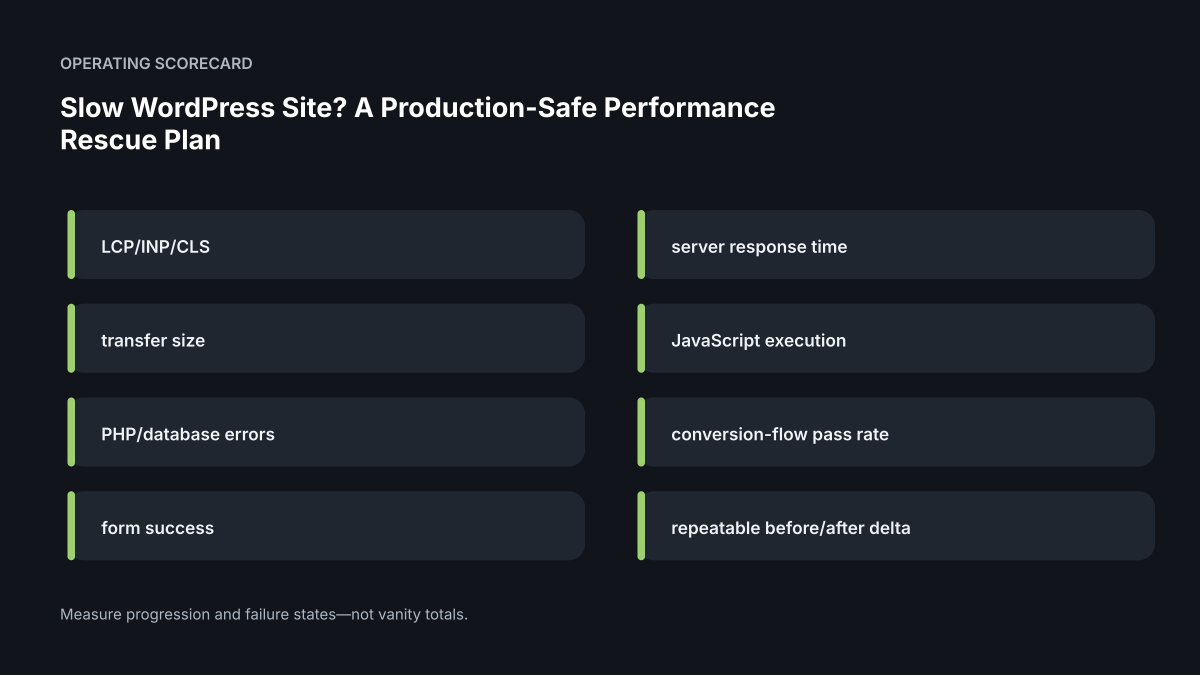
| Measure | Why it matters |
|---|---|
| LCP/INP/CLS | Turns the operating state into a measurable signal that can drive a decision. |
| server response time | Turns the operating state into a measurable signal that can drive a decision. |
| transfer size | Turns the operating state into a measurable signal that can drive a decision. |
| JavaScript execution | Turns the operating state into a measurable signal that can drive a decision. |
| PHP/database errors | Turns the operating state into a measurable signal that can drive a decision. |
| conversion-flow pass rate | Turns the operating state into a measurable signal that can drive a decision. |
| form success | Turns the operating state into a measurable signal that can drive a decision. |
| repeatable before/after delta | Turns the operating state into a measurable signal that can drive a decision. |
Common mistakes to avoid#
Do not install multiple optimization plugins that overlap. Do not purge database tables without verified backups. Do not disable plugins in production just to test a theory. Do not optimize only the homepage.
Performance work is production work and should follow the same evidence and rollback discipline as functional changes.
Founder decision questions#
Ask whether the site is slow for real users on the pages that matter or simply receives a disappointing lab score. Which pages and devices are affected? Is the delay coming from transfer size, browser work, server execution, database behavior or an external service? What functionality is at risk if the proposed optimization changes caching or scripts?
These questions protect the business from generic “speed packages.” A useful provider should be able to name the measured bottleneck and show how the proposed change addresses it.
Procurement brief#
A performance-rescue brief should define representative pages, baseline measurements, conversion-critical interactions, backup/recovery requirements and the production constraints on testing. Ask for changes to be documented individually enough that their effect can be verified.
Acceptance should include repeated measurements plus functional regression tests. Forms, checkout, authentication, analytics and dynamic content deserve explicit verification after caching or JavaScript changes. The result should be a faster, still-correct site—not merely a better screenshot from a testing tool.
Deep-dive: isolate performance work as a controlled experiment#
Performance rescue should change one meaningful constraint at a time whenever practical. If caching, image processing, database indexes, PHP settings and plugin configuration all change together, the team may obtain a faster page without learning which change produced the result or which change caused a regression. A controlled sequence preserves evidence and makes rollback smaller.
Start with a page set that represents business behavior: homepage, a high-traffic editorial page, the primary service or product page, a form or checkout path and an authenticated or personalized path if one matters. Record field data where available, then run repeatable lab measurements from a known environment. The baseline should include functional checks as well as timing so a “faster” result cannot hide a broken form or missing personalization.
Worked scenario: product pages slow down after a feature release#
Suppose a WooCommerce-style product catalogue remains fast on category pages but product-detail pages become noticeably slower after a merchandising feature is introduced. The temptation is to install another cache layer. Instead, compare server response behavior, database activity, third-party calls and front-end payload between a representative fast page and a slow page.
If the slow page shows a server-side delay before the HTML begins, front-end image optimization is unlikely to be the primary fix. Isolate the new feature in a staging or safe test surface, compare query behavior and external requests, and measure again. If disabling one feature restores the baseline, the team has evidence for a targeted repair rather than a general “WordPress is slow” diagnosis.
If the server responds quickly but the page becomes interactive late because of large scripts, fonts or images, the repair moves to the delivery layer. The point is to let the measured bottleneck choose the intervention.
Use server timing when the application can expose it safely#
The W3C Server Timing specification defines a way for servers to communicate request-response performance metrics to the user agent, allowing application-specific server measurements to appear alongside browser performance data. Where the stack supports it, carefully chosen timing markers can help distinguish application execution from network and rendering time without exposing sensitive internals.
Do not expose database names, internal hosts, customer identifiers or other sensitive details in public timing headers. The value is in coarse, purposeful measurements such as application processing or cache state, not in turning the browser into a diagnostic dump.
Separate cache correctness from cache presence#
“Caching is enabled” is not an acceptance criterion. Identify what is cached, for whom, for how long, how invalidation occurs and which pages must remain dynamic. Test logged-in users, carts, personalized fragments, form tokens and other stateful behavior. A cache that produces stale or cross-user data is a correctness failure even if performance scores improve.
For each cache layer—browser, CDN, page cache, object cache or application cache—name its owner and invalidation path. During incident response, the team should know how to bypass or clear the relevant layer without indiscriminately flushing everything.
Treat plugin diagnosis as dependency analysis#
Plugin count by itself is weak evidence. A single plugin can create expensive database queries or remote calls, while many small plugins may have negligible impact. Group extensions by function and inspect the measured cost of the functions involved in the slow path. Check whether the behavior changes with the extension disabled in a safe environment and whether the same business capability can be implemented more efficiently.
Keep an evidence record: page tested, configuration, plugin or feature state, timing observations, functional result and rollback instruction. This turns performance work into a reproducible investigation instead of folklore.
Release gradually when the affected path carries revenue#
For checkout, booking, lead generation or membership flows, performance changes deserve the same release discipline as functional changes. Verify backups, rehearse rollback, test normal and failure cases, monitor errors and business completion signals, and keep the change window small enough to observe. If the optimization requires a hosting or infrastructure change, separate that migration from unrelated visual or content work.
Performance handover packet#
The final record should include the baseline page set, measurement method, bottleneck classification, changes made, before/after evidence, regression checks, cache architecture, important server settings, remaining constraints and rollback instructions. A future maintainer should be able to understand why the site is configured this way without repeating the entire investigation.
Add database and PHP evidence without exposing internals#
When server execution is the suspected bottleneck, collect aggregate evidence such as slow request paths, query counts or durations, object-cache effectiveness and PHP worker pressure where the hosting stack exposes them. Avoid copying credentials, full customer payloads or sensitive database contents into performance reports. The evidence should identify the class of bottleneck while respecting operational security.
Compare measurements over several runs because a single cold or warm request can mislead. Note cache state, authentication state and test environment. If a host provides application performance monitoring, use it to locate slow functions or external calls, but confirm the finding with a controlled change before declaring causation.
Performance budgets should protect the business path#
A performance budget can define limits for page weight, critical script growth, image dimensions or server response on representative pages. Treat the budget as a review trigger rather than a universal promise. A new feature may justify additional cost, but the team should understand the trade-off and verify that the business path remains usable.
Keep budgets close to the release process so regressions are visible before they become the new baseline. When a budget is intentionally exceeded, record why and what compensating work is planned.
Do a cold-start and recovery check#
After cache clears, deploys or server restarts, some sites behave very differently from their warm steady state. Include a controlled cold-start check when relevant and verify that recovery does not create errors, stampedes or unusually long blocking work. This is especially important when multiple cache layers or background jobs rebuild state after deployment.
Buyer checklist#
Before approving the work, confirm:
- The team can state the field data condition in plain language.
- The front-end payload evidence is inspectable rather than assumed.
- Ownership for server/php is named.
- A failure involving database has a defined response.
- The third parties signal is measured after release.
- The team knows how functional regression is restored or handed over.
Release / acceptance gate#
| Gate | Evidence required before calling the work complete |
|---|---|
| Rollback | Backups and restore path are verified. |
| Baseline | Representative pages and devices have repeatable measurements. |
| Isolation | The proposed change targets a measured bottleneck. |
| Functionality | Forms, checkout and dynamic behavior pass regression tests. |
| Measurement | The same baseline is rerun after change. |
| Record | The change and observed effect are documented. |
A performance change should be rejected when it improves a score by breaking business-critical behavior.
Related Sazvara guidance#
- /services/
- /contact/
- /insights/inherited-wordpress-rescue/
- /insights/website-form-to-revenue/
- /insights/technical-handover-standard/
Editorial note#
The linked WordPress, browser, web-performance and W3C material supports the technical facts used here. The rescue sequence and examples are Sazvara analysis; timing improvements must be measured on the actual site and are not promised in advance.
Sources and further reading#
- W3C Server Timing
- Core Web Vitals
- WordPress performance optimization
- WordPress caching
- WordPress Site Health
- WordPress backups
- WordPress hardening
- Lighthouse overview
- Chrome performance docs
- web.dev image performance
- web.dev font performance
Next step#
Request a WordPress performance rescue assessment. Start with the highest-consequence path described in this guide, capture a baseline, and require observable acceptance evidence before expanding the scope.
Have a system that is stuck, manual or difficult to ship?
Sazvara diagnoses the system before prescribing the technology. Bring the constraints, failure modes and current state.