A practical observability system for business automations across n8n, Make, Zapier and custom services, focused on business state, failure visibility and recoverability. 
Editorial promise#
This playbook is deliberately platform-neutral. Vendor execution histories are treated as evidence sources, while the primary design object is the business item moving through observable states.
The Sazvara framework#
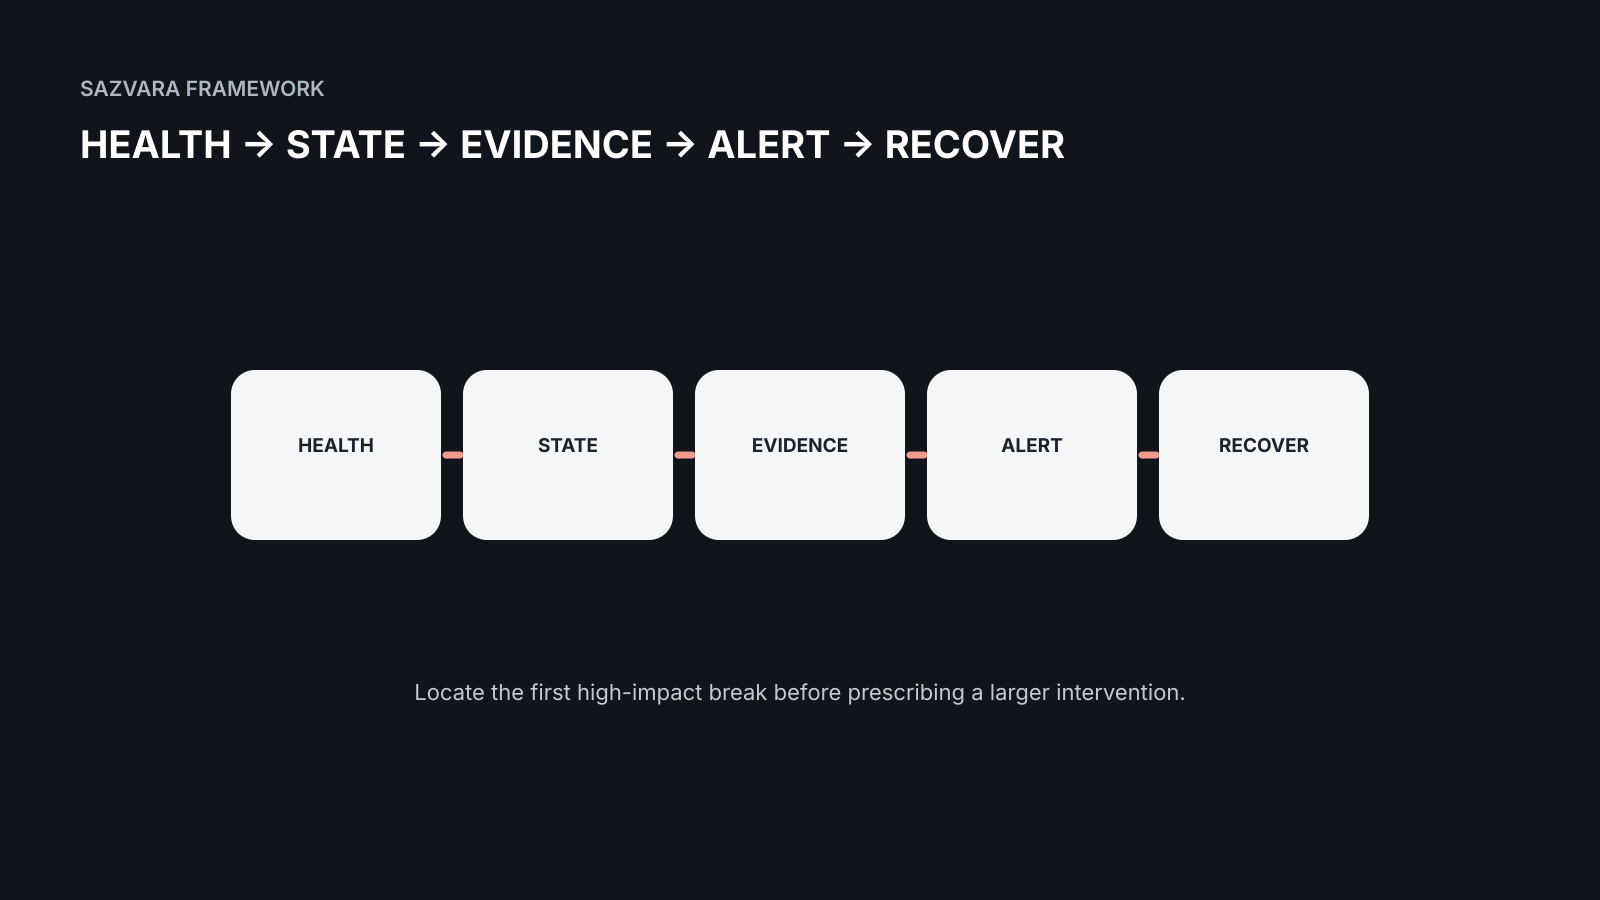
HEALTH → STATE → EVIDENCE → ALERT → RECOVER
The short answer#
Automation observability means being able to answer five questions quickly: Is the workflow running? What business state is each item in? What evidence explains the current state? Who is alerted when something is wrong? Can the operation be recovered safely?
Execution history alone is not enough. A workflow can show green runs while customer records are duplicated, leads remain unassigned or a downstream action silently fails.
Evidence anchors#
- n8n execution docs — Execution history is a useful diagnostic layer but still needs business-state interpretation.
- n8n all executions — Execution views support inspection of workflow runs and failure context.
- Make error handling — Error handlers and incomplete executions support recovery patterns that need process design.
- Make incomplete executions — Incomplete execution states can preserve work for later resolution.
- Zapier troubleshooting — Platform diagnostics can help identify failed steps but do not define business ownership.
- Zapier replay — Replay should be paired with safe repeated-effect behavior.
- OWASP logging — Logs should capture relevant security and operational events without excessive sensitive data.
- AWS reliability pillar — Reliable workloads include failure management and recovery planning.
- Google Cloud reliability — Operational readiness and recovery are part of reliability engineering.
- OpenTelemetry observability primer — Traces, metrics and logs serve different but complementary diagnostic roles.
Monitor business states#
Define states that matter to the process: received, validated, queued, processed, assigned, acknowledged, failed, retrying and manually resolved. The exact vocabulary depends on the workflow.
Business-state monitoring lets operators understand work in progress without reading low-level logs.
Give each unit of work an identifier#
A correlation identifier connects events across website, automation platform, API calls and downstream systems. Without it, incident investigation becomes a manual search through timestamps and partial data.
Use identifiers that do not expose secrets and keep them consistent through retries.
Log boundaries, not everything#
Capture the input state, key decision, external call result and resulting state at critical boundaries. Avoid dumping entire payloads when a few fields are enough for diagnosis.
Good logging is selective and structured.
Differentiate retryable and terminal failures#
A timeout may be retryable; invalid business data may require human review; a permission failure may require configuration repair. Classify failures so the workflow does not treat every error the same way.
This classification also improves alert quality.
Alert on impact#
Do not alert on every transient error. Alert when failures persist, queues grow, critical states exceed time limits or a high-consequence action fails.
Alerts should point to an owner and include enough context to start diagnosis.
Track silent degradation#
Some failures do not throw exceptions: fewer leads are routed, a branch stops matching, an enrichment field becomes empty, or a notification still sends while the CRM write fails.
Use volume and ratio checks to detect unexpected changes in behavior.
Design recovery paths#
For each failure class, define whether to retry, replay, manually resolve, compensate or stop. Recovery should preserve idempotency and avoid creating duplicate effects.
Document the operator action so recovery does not depend on the original builder being available.
Measure reliability in business terms#
Useful measures include completion rate, time in state, backlog size, retry rate, manual intervention rate and business-outcome success.
Platform uptime is useful context but does not describe whether your specific process is working.
Version workflow changes#
A failure investigation needs to know which version was running. Use source control or platform versioning where available, and record release times.
Changes to credentials, routing rules and external dependencies should also be visible in the operational history.
Create synthetic checks#
Periodic test items can confirm that critical routes still work. Design them so they are easy to recognize and clean up.
Synthetic monitoring is especially valuable for low-volume but high-value workflows where a broken system might otherwise remain unnoticed for days.
The weekly reliability review#
Review persistent errors, unusual queue growth, repeated manual fixes, changing external APIs and any incident where the business outcome differed from the expected workflow outcome.
A short review prevents reliability debt from accumulating invisibly.
When no-code observability stops being enough#
As state, concurrency and failure cost increase, visual automation execution logs may stop providing sufficient control. That is a signal to add a dedicated data store, queue, custom service or monitoring layer—not necessarily to rewrite everything.
Keep orchestration visual where it helps and move the high-risk core into components that are easier to test.
Where Sazvara fits#
Sazvara's automation work emphasizes observable outcomes and recovery rather than only successful demos. A diagnostic can map one critical workflow, identify invisible failure modes and define the minimum monitoring and recovery controls.
This is often a smaller and faster intervention than replacing the automation platform.
What good looks like in practice#
A well-operated automation exposes the state of work, not just the status of executions. Operators can see what was received, what completed, what is waiting, what failed, how long items have been in each state and which conditions require intervention. A correlation identifier connects the evidence across platform logs, APIs and downstream systems.
Good observability is intentionally selective. It records the boundaries needed for diagnosis, avoids unnecessary payload retention, and alerts on business impact rather than every transient exception. Recovery is part of the design: the runbook says whether to retry, replay, compensate, manually resolve or stop. This is what turns an automation from a hidden dependency into an operated business system.
Decision table#
| Signal | What it usually means | First action |
|---|---|---|
| Platform run is green, business item is stuck | Semantic failure | Track business states, not only execution status. |
| Operators search manually by timestamp | Traceability gap | Add a correlation identifier across systems. |
| Every transient error sends an alert | Alert fatigue | Alert on persistent or high-impact conditions. |
| Retries create duplicate effects | Recovery risk | Classify idempotency before enabling replay. |
| No one knows queue age | Backlog blindness | Measure counts and time-in-state. |
| Only original builder can recover items | Knowledge risk | Write operator recovery steps and ownership. |
Worked scenario#
A multi-step automation imports form submissions, enriches a company record, assigns an owner and sends a Slack notification. The platform dashboard shows successful executions, yet the sales team reports missing leads. Investigation reveals that the enrichment step occasionally returns an empty company ID; the workflow continues successfully but the CRM assignment branch silently skips.
An observability layer detects this as a business-state failure: records remain “received” but never reach “assigned” within the expected window. The alert is based on time-in-state rather than platform error status. This is the distinction between monitoring a tool and monitoring an outcome.
Implementation sequence#
Name the states first. Add a correlation ID, then log transitions at only the important boundaries. Create one dashboard showing counts and age by state. Add alerts for stuck or growing queues. Finally, document safe recovery actions for each failure class.
Do this on one critical workflow before creating organization-wide monitoring infrastructure.
Measurement plan#
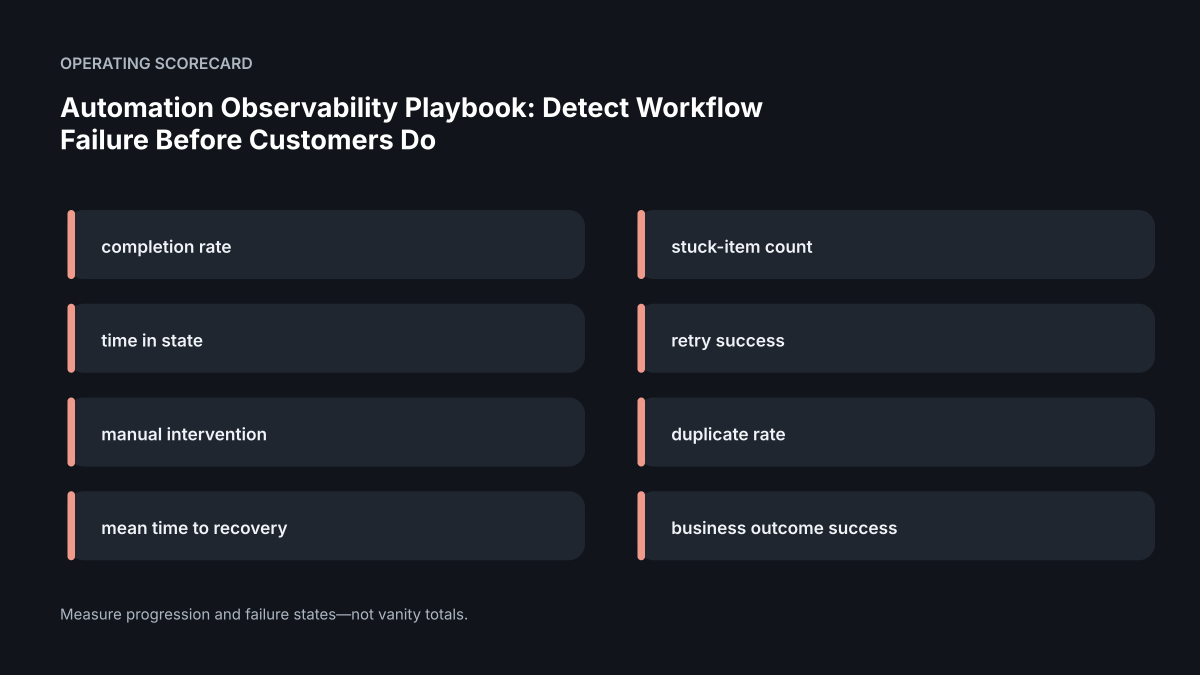
Useful reliability measures include completion rate, median and maximum time in state, stuck-item count, retry success, manual-intervention rate, duplicate rate and mean time to recovery. For revenue-bearing workflows, include the associated business outcome.
Measure trends rather than reacting to every transient blip.
Operating scorecard#
| Measure | Why it matters |
|---|---|
| completion rate | Turns the operating state into a measurable signal that can drive a decision. |
| stuck-item count | Turns the operating state into a measurable signal that can drive a decision. |
| time in state | Turns the operating state into a measurable signal that can drive a decision. |
| retry success | Turns the operating state into a measurable signal that can drive a decision. |
| manual intervention | Turns the operating state into a measurable signal that can drive a decision. |
| duplicate rate | Turns the operating state into a measurable signal that can drive a decision. |
| mean time to recovery | Turns the operating state into a measurable signal that can drive a decision. |
| business outcome success | Turns the operating state into a measurable signal that can drive a decision. |
Common mistakes to avoid#
Logging every payload creates noise and privacy risk. Alerting on every error creates fatigue. Relying only on platform execution status misses semantic failures. Replaying without idempotency can create more damage than the original incident.
Observability should shorten diagnosis and recovery, not become another system nobody watches.
Founder decision questions#
Ask whether the team can answer, in under five minutes, how many items are currently waiting, failing, retrying or stuck in a critical workflow. Can one customer case be traced across systems? Does the alert identify the business consequence or merely repeat a platform error message? Can an operator recover an item without editing production data manually?
If these answers depend on a single builder remembering where to look, the workflow has knowledge risk as well as technical risk. Observability should make the operating state legible to more than one person.
Procurement brief#
A practical observability brief should list the workflow states, correlation identifier, important boundaries, failure classes, alert thresholds, owner and recovery actions. Keep the first version small. One state table, one meaningful dashboard and a few impact-based alerts are often more valuable than a large monitoring stack.
Require proof using synthetic failures: force a downstream timeout, an invalid record and an unmatched routing case. Confirm that each produces the expected state, evidence, alert and recovery path. This tests the operating model rather than only the happy path.
Deep-dive: build an event model that explains business state#
Observability starts with deciding which state transitions matter. A workflow log that contains hundreds of technical lines but cannot answer whether an order was charged, a lead was assigned or a document was delivered is not sufficient. Give each unit of work a durable identifier and record the boundaries that change business state: accepted, validated, sent to dependency, acknowledged, completed, retried, escalated and failed.
CISA describes logging and monitoring as complementary practices: logs record activity while monitoring reviews those records to identify unusual or important behavior. NIST log-management guidance similarly treats sound log management as an operational process rather than a pile of files. For business automation, the same principle means retaining enough structured evidence to reconstruct a run without logging sensitive data indiscriminately.
Worked scenario: a lead sync is only partially down#
Suppose a website receives leads, enriches them, creates CRM records and sends assignment notifications. The CRM API begins returning intermittent timeouts. Some calls succeed, some fail, and the website itself remains healthy. A simple uptime check stays green because every service responds eventually. Customers may not report a problem because the form confirmation page still appears.
A business-state event model exposes the degradation. The system can compare lead_received with crm_record_created and owner_assigned. A widening gap shows that work is entering the process faster than it is reaching the owned state. Retry counts and queue age reveal whether the backlog is clearing or growing. An alert can therefore be based on unresolved business work rather than raw error volume.
When the dependency recovers, the team should be able to replay unresolved items using the original identifiers. Idempotency controls prevent successful records from being created twice. The incident report can state how many units entered the exception state, how many were recovered, which configuration was active and whether any manual reconciliation remains.
Define service objectives around consequence#
Not every workflow needs the same reliability target. A nightly internal report can tolerate a different delay from a payment acknowledgement or sales enquiry. Define an operating objective in terms the business can understand: maximum unresolved age, maximum queue depth, acceptable retry window, or time to named ownership. Pair the objective with a response rule.
Avoid universal percentages unless the business has enough baseline data to justify them. Early in an observability program, absolute conditions can be easier to operate: “no qualified enquiry may remain unassigned beyond the agreed service window” or “every failed payment-notification run must create a visible exception.” As data accumulates, trend measures can become more sophisticated.
Protect logs as operational assets#
Logs may contain customer identifiers, request payloads, authentication context or commercially sensitive metadata. Record the minimum information needed for diagnosis, restrict access, define retention and avoid placing secrets in messages. CISA explicitly recommends protecting logs from unauthorized access or deletion and establishing procedures for how they are reviewed.
A useful event schema separates correlation identifiers from sensitive content. The operator should be able to locate the affected transaction without copying the full payload into every system. Where payload inspection is necessary, use controlled access and document why that data is retained.
Instrument recovery, not only failure#
A system that raises an alert but cannot prove recovery is only half observable. Record when a failed item is retried, when manual intervention occurs, when the dependency becomes healthy and when the business state is reconciled. Recovery events let the team distinguish a transient incident from an unresolved backlog.
Add a synthetic test for the most important path. The synthetic run should be clearly identified so it cannot be mistaken for a real customer transaction. It verifies that the workflow can traverse the critical boundaries and that the resulting evidence is visible. GitHub Actions exposes workflow status and run logs that can be used to diagnose failed automation jobs; the same operating idea applies to other workflow platforms even when the implementation differs.
Run an observability review after every material change#
A workflow change can invalidate alerts without breaking the workflow itself. New branches may introduce states that are not counted, a renamed field may break a dashboard, or a new retry mechanism may hide repeated failures behind eventual success. Include observability verification in the release gate: produce a normal run, a controlled failure and a recovery run, then confirm the expected events and alerts appear.
Version the event schema and dashboard definitions alongside the workflow where practical. When a metric changes meaning, annotate the change so historical trends are not interpreted as if the definition were constant.
Incident handover packet#
For each important workflow, retain the correlation-ID format, state-transition map, log locations, alert rules, ownership contacts, retry and replay procedure, data-retention rules, known dependency limits and last recovery-test evidence. This allows another operator to investigate a failure without reverse-engineering the automation under pressure.
Three questions that reveal weak observability#
Ask whether the team can identify every currently unresolved unit of work, explain why each one is unresolved, and recover it without creating a duplicate external action. If any answer is “no,” adding more dashboards is secondary. First improve the state model and recovery evidence.
Build dashboards from questions, not available metrics#
Start each dashboard with an operator question. “Which customer-impacting items are unresolved right now?” is stronger than “how many workflow executions failed?” because it defines the action the view should support. Other useful questions include which dependency is causing the backlog, whether retries are clearing, whether a release changed failure patterns, and which items require manual reconciliation.
Group technical metrics under those questions. Queue depth, error codes, latency and retry count are useful when they explain the business state. Avoid placing dozens of platform metrics on a page simply because the platform exposes them. A smaller dashboard with clear ownership and response rules usually produces better incident behavior.
Define an escalation ladder#
Not every alert needs the founder. Create levels based on consequence and duration. A transient retry can remain informational; an unresolved customer action beyond the service window may page an operator; a sustained failure on payments or lead intake may trigger a broader incident response. Document who receives each level, how acknowledgement is recorded and what condition closes the alert.
Test the ladder. An alert that exists only in configuration is not evidence that the organisation will respond. Run a controlled failure, confirm the right person receives the signal, and record whether they can locate the affected items and execute the recovery procedure.
Preserve observability during handover#
When ownership changes, transfer dashboards, alert destinations, log access, retention settings, synthetic checks and the meaning of key states. Remove departing users and verify that at least one new operator can investigate a recent run without assistance. Observability is part of the system's operational ownership, not an optional monitoring add-on.
Buyer checklist#
Before approving the work, confirm:
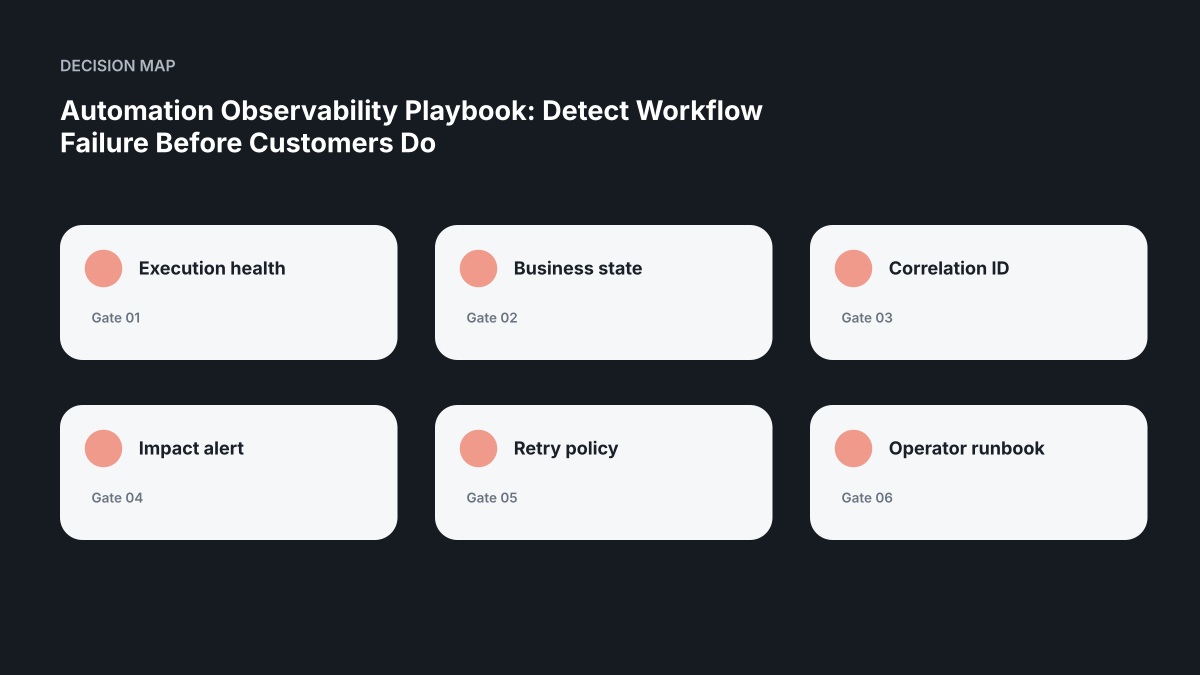
- The team can state the execution health condition in plain language.
- The business state evidence is inspectable rather than assumed.
- Ownership for correlation id is named.
- A failure involving impact alert has a defined response.
- The retry policy signal is measured after release.
- The team knows how operator runbook is restored or handed over.
Release / acceptance gate#
| Gate | Evidence required before calling the work complete |
|---|---|
| State model | Critical business states are named. |
| Correlation | One identifier follows an item across systems. |
| Evidence | Boundary logs answer what happened and when. |
| Alerting | Thresholds map to business impact and an owner. |
| Replay | Recovery is safe to repeat where needed. |
| Runbook | Operators can resolve common failures without the builder. |
An automation should not be called operated until failure states are visible, owned and recoverable.
Related Sazvara guidance#
- /services/
- /contact/
- /insights/automation-success-vs-business-success/
- /insights/when-no-code-becomes-fragile/
- /insights/n8n-vs-zapier-vs-make-ownership/
Editorial note#
Cited platform and security guidance supports the logging, monitoring and workflow facts in this playbook. The business-state event model, service objectives and recovery tests are Sazvara operating synthesis; no universal reliability percentage is implied.
Sources and further reading#
- CISA: Use Logging on Business Systems
- NIST: Guide to Computer Security Log Management
- n8n execution docs
- n8n all executions
- Make error handling
- Make incomplete executions
- Zapier troubleshooting
- Zapier replay
- OWASP logging
- AWS reliability pillar
- Google Cloud reliability
- OpenTelemetry observability primer
Next step#
Request an automation reliability diagnostic. Start with the highest-consequence path described in this guide, capture a baseline, and require observable acceptance evidence before expanding the scope.
Have a system that is stuck, manual or difficult to ship?
Sazvara diagnoses the system before prescribing the technology. Bring the constraints, failure modes and current state.